Roadmap - Now, next, later
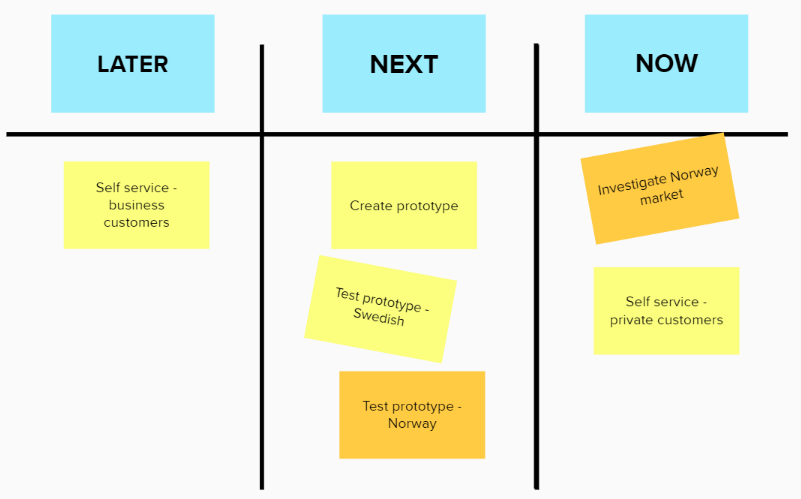
This type of roadmap features a simple format, making it easy to comprehend and quick to initiate. It places a significant emphasis on prioritization and status tracking.
In its most basic configuration, the roadmap encompasses ongoing activities, upcoming work, and what comes next. The content within each column is arranged based on priority, which means that what is at the top of NOW is what has the highest priority.
Focus on
Priority och status
Used e.g. for
Teams
Owned by
Product owner/Product manager
Time perspective
≈ Rolling 3 months
Content size
E.g. hypothesis, assignment, initiative, subproject, epic
It is of course possible to use this roadmap in other ways as well.
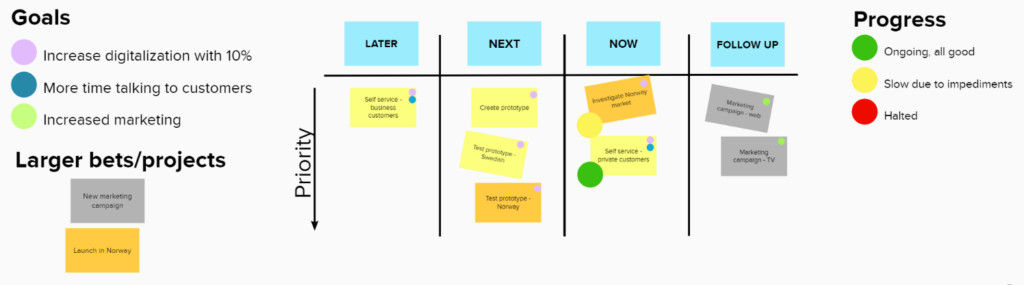
Extended version
Although the simple form mentioned above is useful, I am of the opinion that this kind of roadmap can be made even more effective by incorporating additional attributes and visual representations.
Status
In the simple version, we only see the status in terms of whether something is ongoing on or not, which is sometimes quite blunt. To address this, I generally incorporate visual cues to indicate whether progress is going well, if there are obstacles or if there is a total stop. If something is obstructed, it's a strong signal for everyone to focus on trying to clear that obstacle.

Follow-up
Another tip is to also visualize the need to follow-up. When something is ready / delivered / put into production, in many cases we want to follow up what result it gave. It often takes some time for us to be able to see the effect of what we have done and to visualize that we add a column to the right of Now called Follow-up.
Connection to our goals
In order to be able to visually follow what goes towards which goals, we color-code part of each hypothesis/initiative/subproject/epic.

Connection to larger bets, initiatives or projects
In order to be able to visually follow what drives towards which goals, we color-code a part of each hypothesis / assignment / initiative / subproject / epic.